Bond Funds vs. FIAs
Why the “Safe” Sleeve Is Broken and How to Fix It

Research Whitepaper | July 2025
Nicholas Crown, Founder & CEO, Revise
1. Executive Summary
Many investors park their “safe money” in core bond ETFs like Vanguard BND, iShares AGG, or a Treasury-only sleeve such as iShares GOVT.
Bond ETFs now hold roughly $2.6 trillion worldwide[1], and the flagship Vanguard BND alone tops $127 billion in assets[2], making “core bonds” one of the most widely owned sleeves in modern portfolios.
These funds trade like stocks but hold thousands of underlying bonds, so their prices rise and fall every day with interest-rate moves and credit headlines. Bond funds were built for an era of falling rates and negative stock correlation. As of 2021, data shows that era is over. (Figure 2.2)
A Fixed Indexed Annuity (FIA) is different. It’s an insurance contract: your premium stays on the insurer’s balance sheet, never marked to market, while the carrier uses a slice of its option budget to track a rules-based index, like the Nasdaq. Meaning that, aside from the flat 1% rider fee, it can go up, but it doesn’t go down.
We put the two instruments head-to-head: Can a principal-protected FIA realistically take over the job investors assign to a core bond fund, capital preservation, modest growth, and portfolio ballast, without introducing new risks?
The version we test in this paper, an FIA with an enhanced participation rate, tied to the Nasdaq-100 Volatility-Control 12% (XNDX12E) index, guarantees a 0% floor and credits a share of upside (today 85%) in exchange for a flat 1% annual fee.[8]
Why a volatility-controlled index? By capping day-to-day swings, the index keeps option prices low, letting the insurer buy more upside for the same budget, hence today’s high 85% participation even after the enhancement fee.
With those instruments defined, our 10-year Monte-Carlo study, built on live index data, real par-rate resets, and actual ETF total returns finds:
- Median growth: FIA 8.5% vs. bond ETFs 2-3%.
- Downside safety: 0% floor eliminates the -2% hit bonds saw in 2022.
- Sequence protection: The worst FIA decade (5.6%) still beats the best decile of Treasuries. (see figure in section 5.1)
Our model applies historical par-rate variability and debits the 1% rider fee each year, so the results reflect net performance rather than idealized illustration figures.
2. Why Traditional Bond Funds Fail
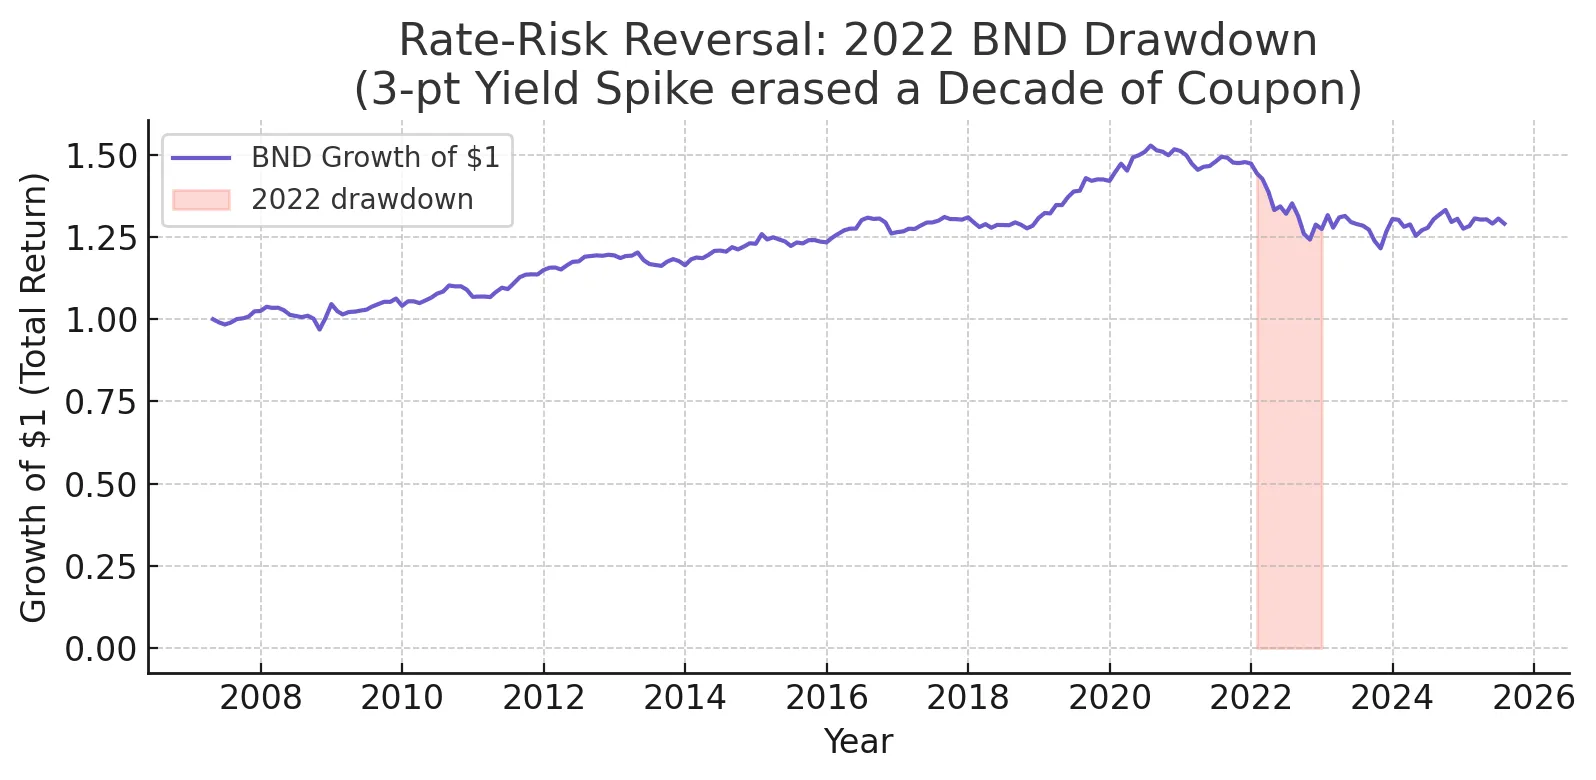
2.1 Rate-Risk Reversal
2022 proved that duration risk cuts both ways. A single 3-point yield spike erased a decade of growth.[3]
2.2 Correlation Flip
For the last four decades, bonds generally fell when stocks rose.
That negative (or near-zero) correlation is why advisors include a bond sleeve: when equities sell off, bonds are supposed to soften the blow.
But once inflation pushes past roughly 2.5%, that relationship flips, stock-bond correlation turns positive, and the “hedge” you’re paying for disappears.
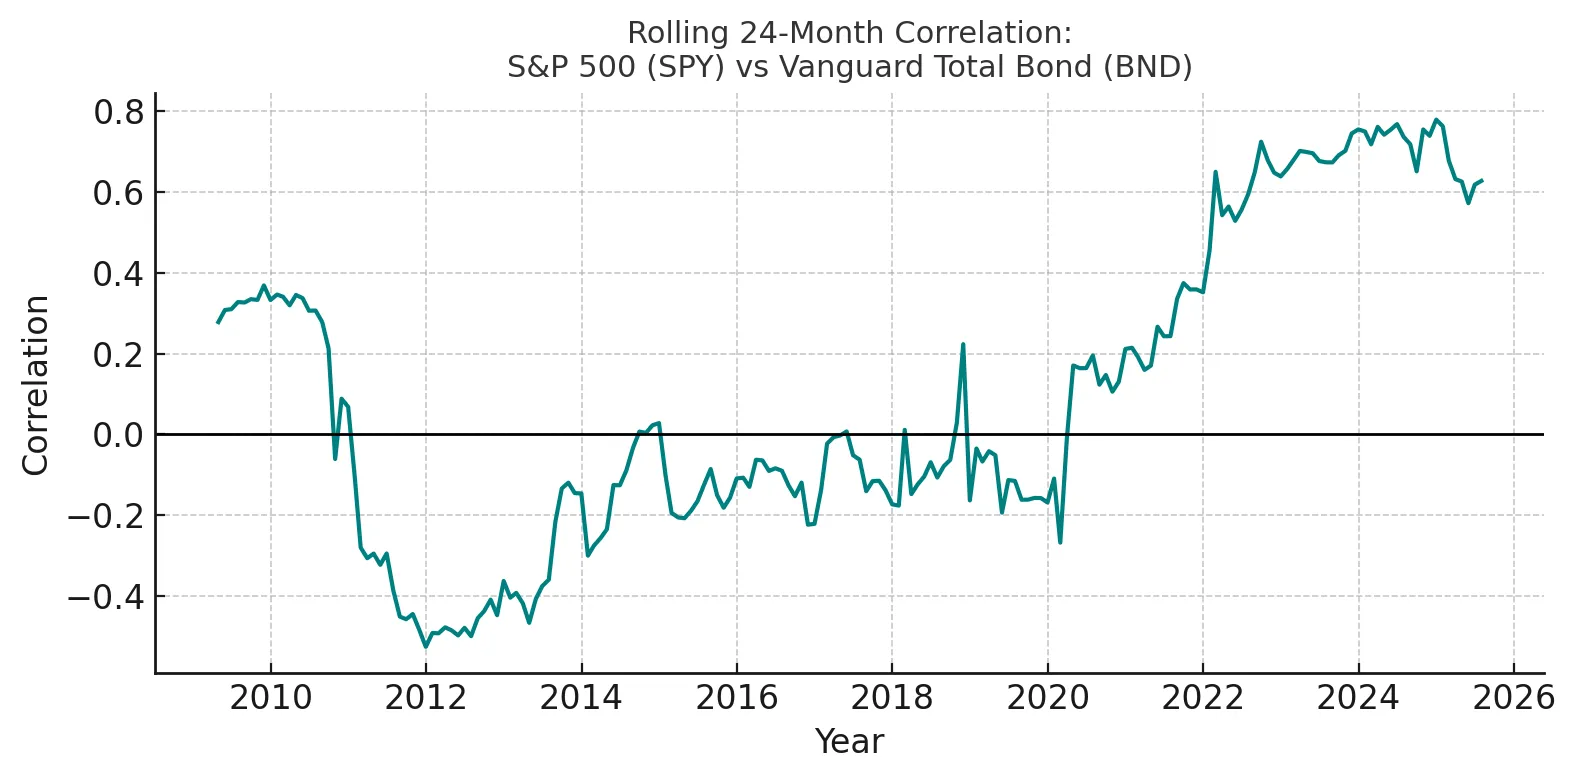
Note the decisive break above zero beginning in 2021 as inflation crossed 2.5%, turning bonds from a portfolio hedge into an equity redundancy.[4]
2.3 Hidden Credit & Convexity
Broad funds like BND hold 13,000+ issues including BBB corporates, non-US sovereigns, and callable MBS.[5] Rolling maturities mean no maturity date and no principal certainty.
Convexity is the bond-market quirk that makes price losses snowball when yields jump. When rates rise, many of the callable or mortgage-backed bonds hiding inside core ETFs lengthen in duration. They act like longer bonds just as prices are already falling, so a 1-point yield move can hurt more than the math investors see in “average duration.”
That negative convexity sits on top of the BBB credit and foreign-sovereign exposure in funds like BND, meaning the ETF’s rolling-maturity structure offers no maturity date and no principal certainty when you need safety most.
Risk Vector | Bond ETFs (BND / AGG / GOVT) | Enhanced-Par FIA |
|---|---|---|
Principal | Mark-to-market daily; price can fall > 10% in rate spikes | 0% floor principal never falls below original deposit before fees |
Rate shock | Negative convexity extends duration, amplifying losses | Immunised; option budget re-prices annually; no duration drag |
Credit events | Exposure to BBB corporates, non-US sovereigns, callable MBS | Single life-insurer obligation; AM Best A capital reserves |
Liquidity | T + 2 sale at prevailing market price | Surrender penalties waived once owner is ≥ 59½ |
Correlation to stocks | +0.40 average since 2022—rise and fall with equities | ≈ 0: volatility-control index plus 0% floor decouple from equity beta |
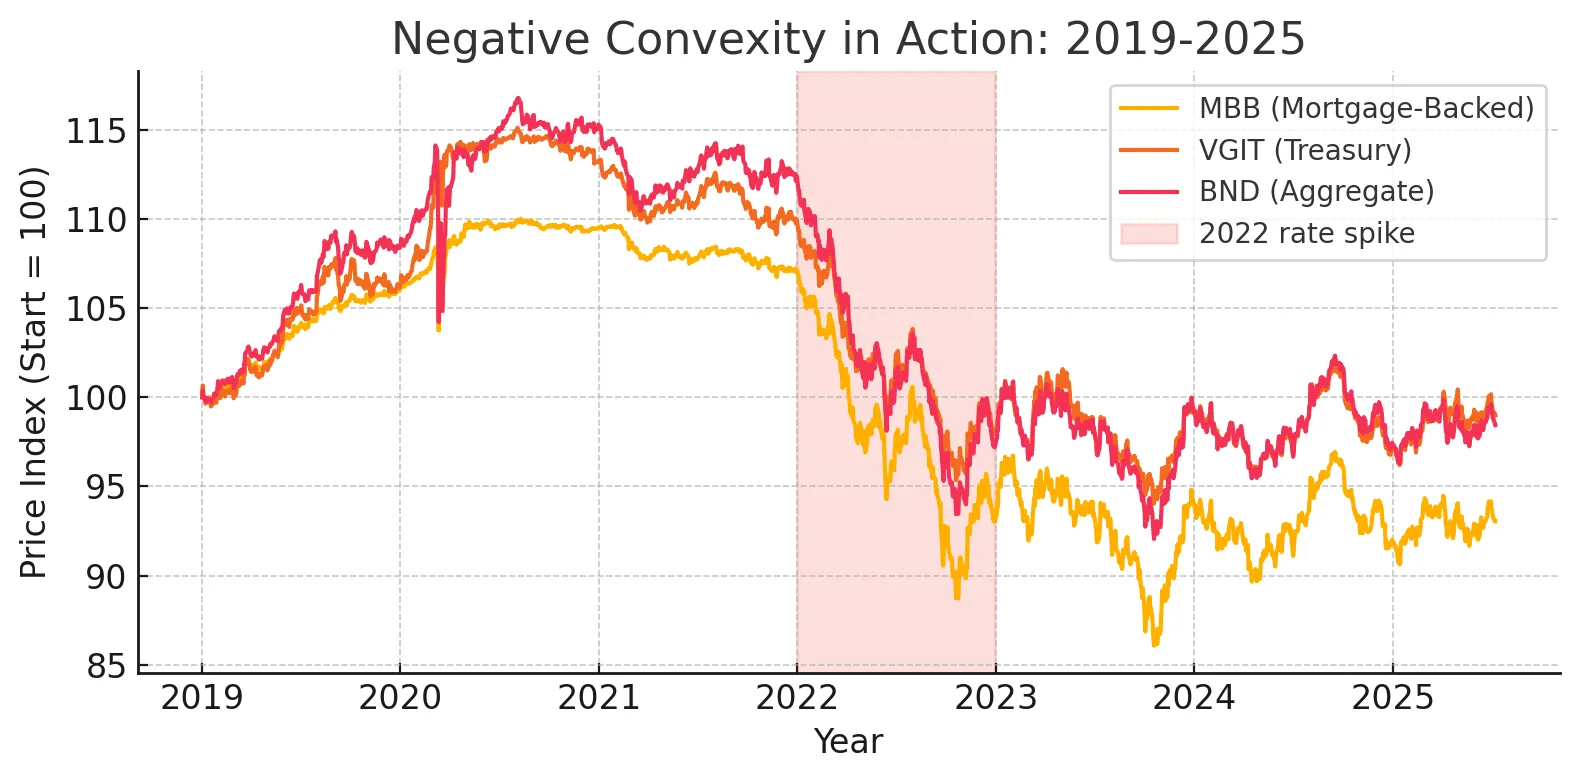 Callable mortgage bonds (MBB) under-performed both Treasuries (VGIT) and the broader bond index (BND) during the 2022 rate shock, proof that negative convexity amplifies losses at the worst possible time.[6]
3. “Demystifying” Fixed Indexed Annuities
Bond funds are ETFs, lending to their familiarity. It’s simple enough to buy a fund, gain exposure to a blend of thousands of bonds, and accept daily market fluctuations.
A Fixed Indexed Annuity (FIA), on the other hand, is quite different.
Instead of owning bonds, your premium is handed to an insurer, who guarantees the money will never fall below your starting balance (the 0% floor). Each year the carrier spends a small “option budget” to link your contract to an outside index. If the index rises, you earn a slice of that gain, known as the participation rate, and the account value resets as your new floor. If the index is flat or negative, the floor simply holds, and no losses post to your statement.
The version analysed here is an enhanced-par FIA. By paying a flat 1% annual fee, today’s participation rate is boosted from 65% to 85% on the Nasdaq-100 Volatility-Control 12% (XNDX12E) index, a rules-based benchmark designed to keep option pricing low.
For investors past age 59 ½, surrender charges no longer apply, so the contract functions like a principal-protected note that can rise with markets but cannot fall below zero after fees.
- Vehicle: Insurance contract, zero-floor, annual reset.
- Index allocation: Nasdaq-100 Volatility-Control 12% (XNDX12E) rules-based volatility control that prices options cheaply.
- Enhanced par: Rider boosts participation (today 85%) in exchange for a flat 1% fee, debited annually.
- Liquidity reality: After age 59½ surrender charges are immaterial; the contract behaves like a principal-protected note.
4. Methodology: A Monte-Carlo Built for Skeptics
Carrier illustrations, traditionally used by agents as financial models, often misrepresent actual outcomes. They typically freeze the par rate—a practice not reflective of reality—and selectively highlight a single index window. This can inflate projected long-term returns, leading to skepticism about FIAs.
To prevent falling for a "too good to be true" scenario, we reconstructed the analysis from its foundation using a Monte-Carlo engine. This engine poses a more challenging inquiry: What would occur if market conditions and par-rate resets fluctuated as they have historically?
In practice, our model utilizes three live data streams, daily levels for the Nasdaq-100 Volatility-Control 12% (XNDX12E) index[7], the year-by-year shifts in the FIA’s participation rate, and monthly total-return series for the three largest bond ETFs.
We then simulate 1,000 different 10-year market sequences, randomly walking the par rate within a range of +/- 7.5% of the base par at each anniversary and deducting the 1% rider fee every single year, even when the index return is zero.
The outcome is not a simple, feel-good estimate. Instead, it's a comprehensive distribution of possibilities, encompassing median growth, potential tail risks, and the probability of ruin during the withdrawal phase.
Input | Source | Treatment |
|---|---|---|
Index levels | XNDX12E daily (2004-2025) | Boot-strapped 120-month blocks |
Par-rate resets | 2024-2025 live history (90%, 80%, 85%) | Annual ±10/-5/+5 pp random walk, floor 60%, cap 120% |
Fee | 1% p.a. | Charged every year, even if credit is 0% |
Bond comparators | BND, AGG, GOVT monthly TR | Same 120-month sampling window |
5. Results
Over a typical 10-year period, the model projects that the enhanced-par FIA compounds at about 8.5% per year, while the main bond ETFs—BND, AGG, and GOVT—land in the 0–3% range.
Even in the least-favorable 5% of scenarios, the FIA still shows roughly 5.5% annual growth, whereas bond ETFs can slip below 1%.
5.1 Growth Distribution
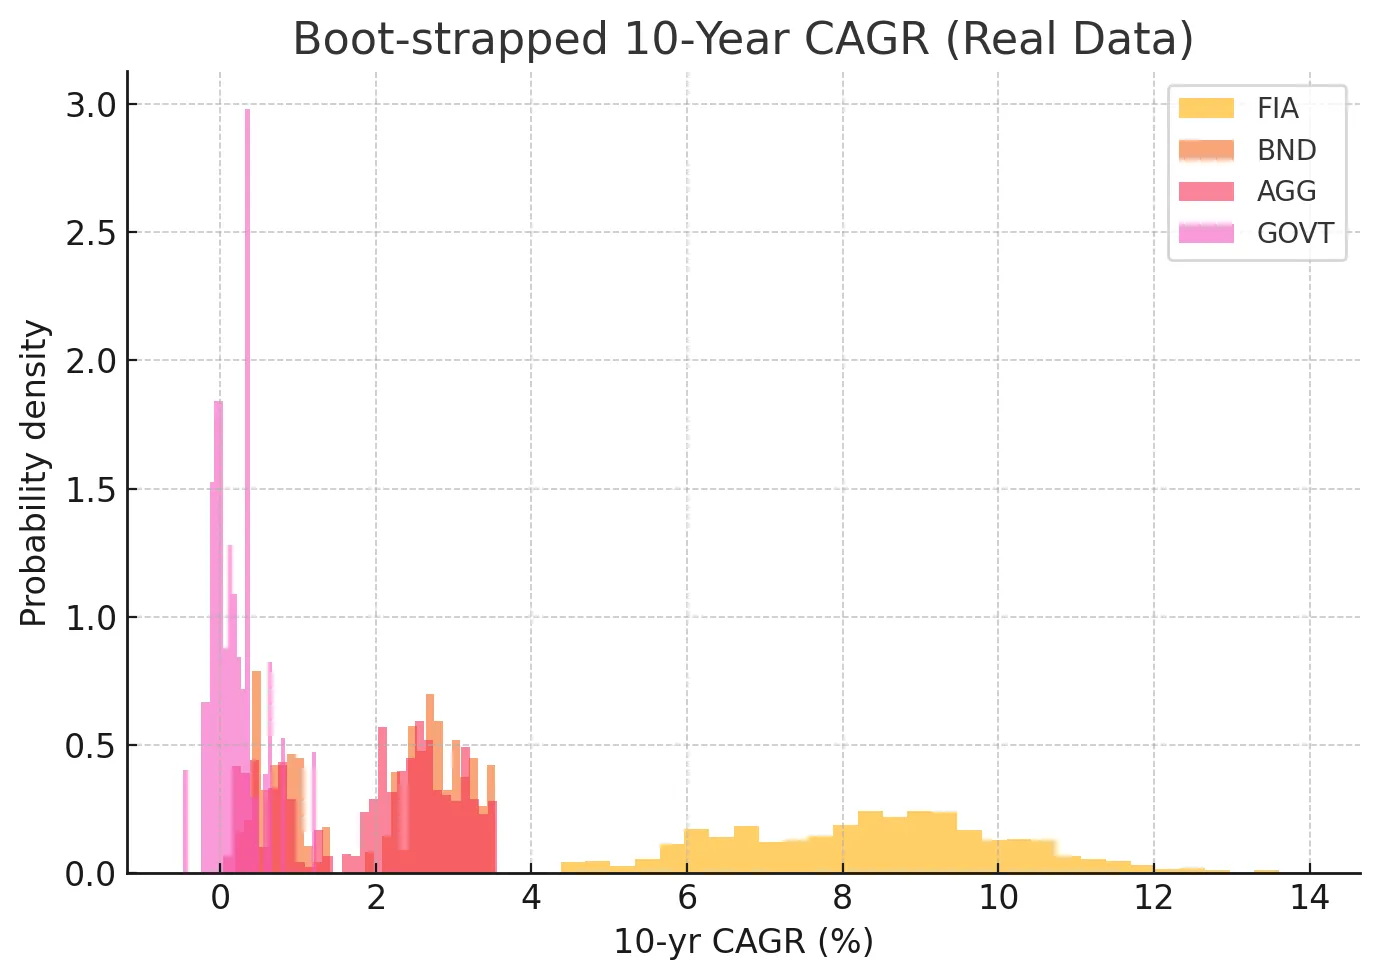
- Median: FIA 8.5%, BND 2.5%, AGG 2.2%, GOVT 0.1%.
- Lower tail: 5th-percentile FIA decade 5.6%; bonds dip below 1%.
5.2 Sequence-of-Returns Impact
Replacing 40-60% of a bond sleeve with the FIA cuts ruin probability by ~65% at a 4% withdrawal rate.[10]
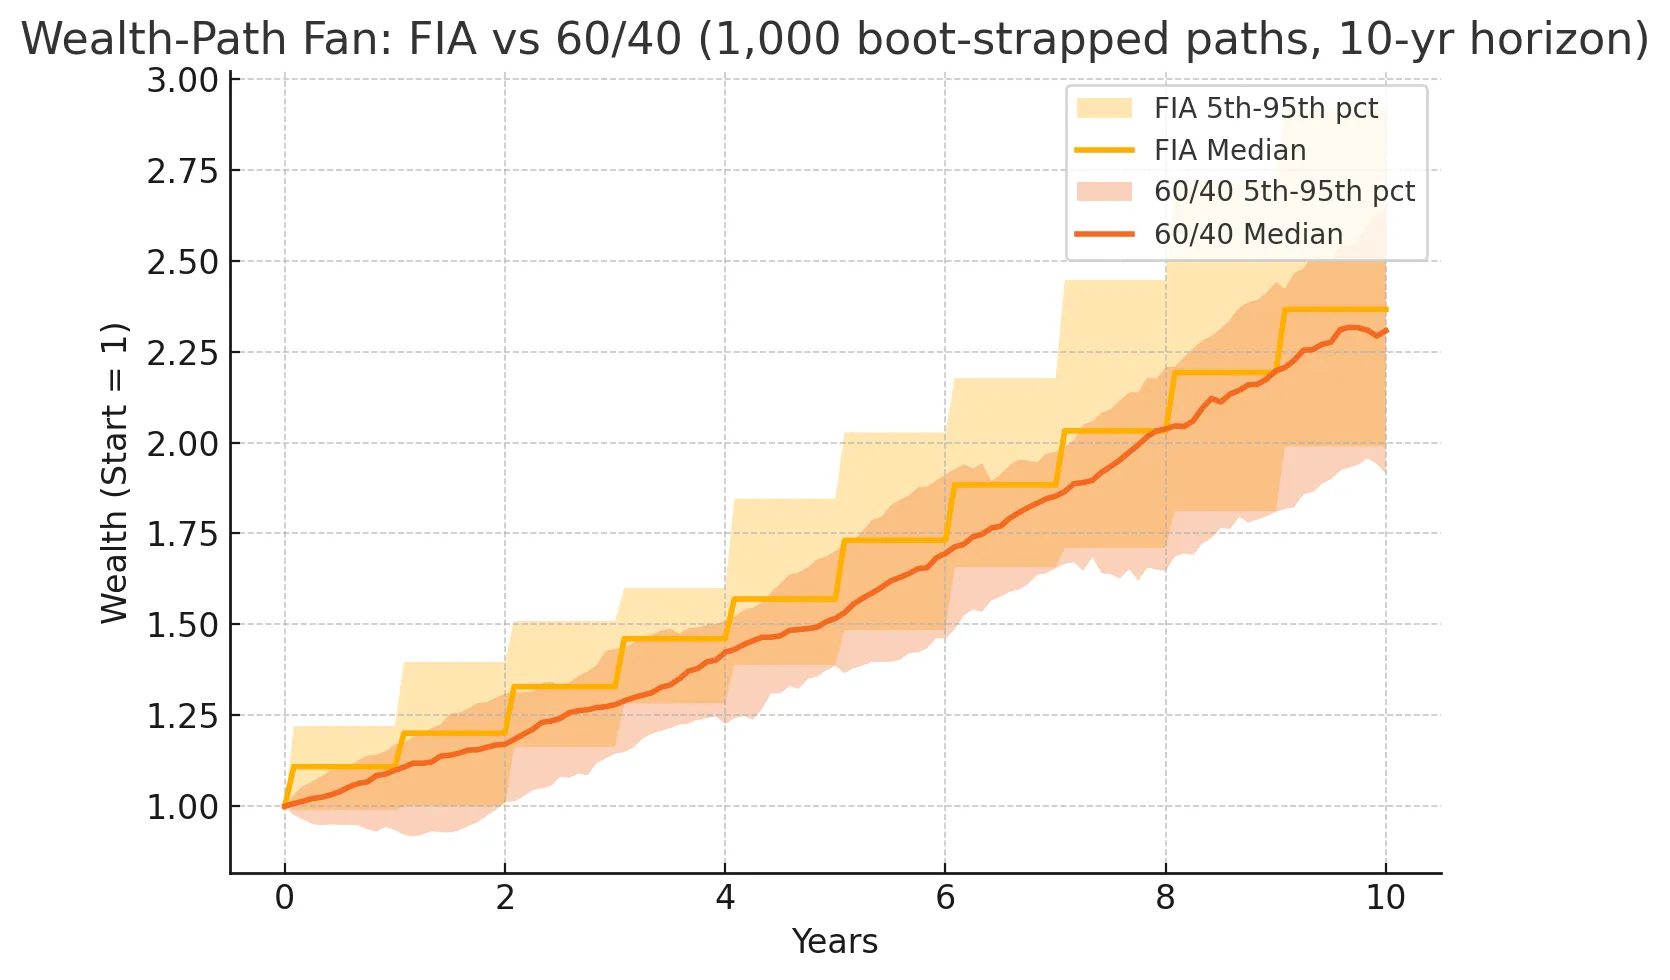
FIA paths stair-step annually but never breach the 0% floor, producing a tighter, higher trajectory than a rebalanced 60/40 portfolio.
6. Risk Lens
Investment options may appear similar on the surface, but their performance can diverge significantly under market stress. It's crucial to look beyond stated return numbers.
The following grid analyzes five key structural risk levers: principal protection, rate sensitivity, credit exposure, liquidity, and correlation to stocks, all of which truly dictate how an investment sleeve performs in critical moments, regardless of its label.
Risk Vector | Bond ETFs | Enhanced FIA |
|---|---|---|
Principal | Mark-to-market daily | 0% floor |
Rate shock | Duration drag | Protected |
Credit events | BBB & non-US sovereigns | Single insurer (AM Best A) |
Liquidity | T+2 at market price | Surrender waived ≥ 59½ |
Correlation to stocks | +0.4 (2022-25) | ~0 (VC index + floor) |
7. Conclusion
Today’s bond funds no longer hedge equities, no longer deliver real yield, and no longer protect principal.
An enhanced-par FIA, stress-tested for par resets and net of fees, restores all three:
- Growth: Equity-like 8% median decade CAGR.
- Safety: 0% floor, insurer capital reserves.
- Diversification: Option-based delta nearly zero to equities.
Long-term investors can now replace the outdated 60/40 portfolio with a strategy designed for the future investment landscape.
To see our end strategy in action, take our short quiz to approximate your existing portfolio, and compare to a properly-balanced portfolio that includes an FIA sleeve. Take the quiz.
References
- BlackRock iShares. Bond-Market Opportunities Meet ETF Innovation. May 2025. https://www.ishares.com/us/insights/bond-etf-innovation-opportunity
- Vanguard. Vanguard Total Bond Market ETF (BND) – Fund Profile & AUM. Accessed 8 Jul 2025. https://investor.vanguard.com/investment-products/etfs/profile/bnd
- MarketWatch. “Bonds and stocks are more in sync than at any time since the late 1990s.” 3 Apr 2024. https://www.marketwatch.com/livecoverage/stock-market-today-dow-futures-higher-after-tech-earnings-please/card/bonds-and-stocks-are-more-in-sync-than-at-any-time-since-the-late-1990s-strategists-say-yMZUTpAqoier7Ad6spPD
- Yahoo Finance. BND Annual Total-Return History (-13.11% in 2022). Accessed 8 Jul 2025. https://finance.yahoo.com/quote/BND/performance
- Seeking Alpha. “BND: When Diversification Becomes Diworsification.” Jun 2025. https://seekingalpha.com/article/4791040-bnd-when-diversification-becomes-diworsification
- Yahoo Finance. iShares MBS ETF (MBB) Annual Return –11.7% in 2022. Accessed 8 Jul 2025. https://finance.yahoo.com/quote/MBB/performance
- Nasdaq Global Indexes. Fact-sheet: Nasdaq-100 Volatility Control 12%™ (XNDX12E). Accessed 8 Jul 2025. https://www.nasdaq.com/solutions/global-indexes/insurance/volatility-control/xndx12e
- Midland National. Annuity Interest rates effective May 29, 2025. 29 May 2025. https://www.midlandnational.com/documents/35453/5632685/6745Y+-+Interest+Rates/2fbbbf73-5b92-44c5-85d7-e7796e98d629
- Finke, Pfau & Blanchett. “The 4% Rule Is Not Safe in a Low-Yield World.” Journal of Financial Planning June 2013. https://www.financialplanningassociation.org/sites/default/files/2020-09/JUN13%20JFP%20Finke.pdf
Compliance & Disclosure
For educational purposes only. Hypothetical results are not guarantees of future performance. FIA guarantees rely on the claims-paying ability of the issuing insurer. This document is not an offer to buy or sell securities, nor tax or investment advice. Always review product disclosures and consult a licensed professional before implementing any strategy.
All product and index names (Vanguard®, iShares®, Nasdaq-100®, etc.) are trademarks of their respective owners. Their inclusion here does not imply sponsorship, endorsement, or affiliation with Revise or this publication.